[!NOTE|label:references]
- MONITORING LINUX HOST METRICS WITH THE NODE EXPORTER
- Kubernetes Resources(四) - Metrics Server 安裝
- Prometheus 5 - Node Exporter & Kube State Metrics
- kube-state-metrics | Tutorial, Setup, and Examples
- Installing Kubernetes Metric Server
- Part-1: Setup Prometheus, Kube State metrics and Integrate Grafana with Kubernetes
- K8s资源限制设置limit未设置request会导致request默认等于limit造成资源浪费
- * How to Setup Prometheus Monitoring On Kubernetes Cluster
code pool
prometheus
[!NOTE|label:references:]
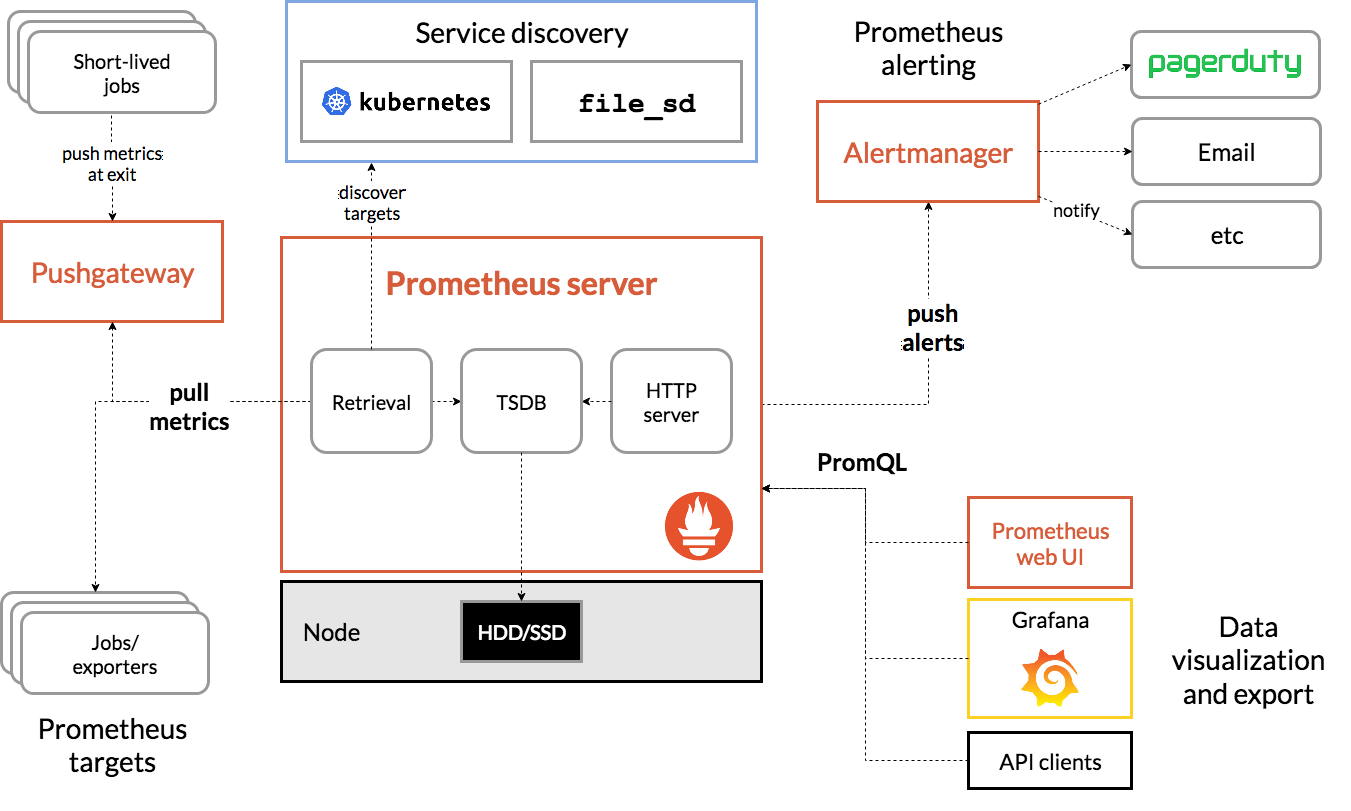
prometheus architecture
grafana
references:
- * play.grafana.org
- * Setting Up Kubernetes Dashboard
- * Deploy Grafana Enterprise on Kubernetes
- * Deploy Grafana on Kubernetes
- * Kubernetes Integration
- * Install plugin from dockerfile
- * grafana/grafana-docker
- Scaling out Grafana with Kubernetes and AWS
- Monitoring Kubernetes Clusters with Grafana
- Configure a Grafana Docker image
- Configure Grafana
- Grafana 6.2 documentation : Installing using Docker
- Restart Grafana
- Grafana Loki Concise Tutorial
- Grafana CLI
- * Prometheus data source
- * GRAFANA SUPPORT FOR PROMETHEUS
- * Create Grafana Dashboards with Prometheus Metrics
how to:
- How To Setup Grafana On Kubernetes
- How To Setup Kube State Metrics on Kubernetes
environment
[!TIP]
- reference Do not use environment variables to add new configuration settings. Instead, use environmental variables to override existing options.
To override an option:
GF_<SectionName>_<KeyName>If you need to specify the version of a plugin, then you can add it to the
GF_INSTALL_PLUGINSenvironment variable. Otherwise, the latest is used. For example:-e "GF_INSTALL_PLUGINS=grafana-clock-panel 1.0.1,grafana-simple-json-datasource 1.3.5"
# for pvc
kubems-01 ~ $ mkdir -p /opt/grafana/plugins
kubems-01 ~ $ sudo chown -R 472:472 $_

# https://grafana.com/docs/grafana/latest/installation/docker/#migration-from-a-previous-version-of-the-docker-container-to-5-1-or-later
# 104:104 for version < 5.1
| Version | User | User ID |
|---|---|---|
< 5.1 |
grafana | 104 |
>= 5.1 |
grafana | 472 |
- path
| SETTING | DEFAULT VALUE |
|---|---|
GF_PATHS_CONFIG |
/etc/grafana/grafana.ini |
GF_PATHS_DATA |
/var/lib/grafana |
GF_PATHS_HOME |
/usr/share/grafana |
GF_PATHS_LOGS |
/var/log/grafana |
GF_PATHS_PLUGINS |
/var/lib/grafana/plugins |
GF_PATHS_PROVISIONING |
/etc/grafana/provisioning |
- environment
| ENVIRONMENT VARIABLE | EXAMPLE |
|---|---|
GF_INSTALL_PLUGINS |
grafana-kubernetes-app,grafana-piechart-panel,http://my.com/plugin.zip |
GF_PATHS_PLUGINS |
/data/grafana/plugins |
GF_SERVER_ROOT_URL |
https://grafana.domain.com |
GF_SECURITY_ADMIN_PASSWORD |
admin |
GF_DEFAULT_INSTANCE_NAME |
- |
GF_SECURITY_ADMIN_USER |
- |
GF_DATABASE_TYPE |
mysql |
GF_DATABASE_HOST |
- |
setup
ns
$ cat << EOF | kubectl apply -f -
---
kind: Namespace
apiVersion: v1
metadata:
  name: kubernetes-dashboard
  labels:
    name: kubernetes-dashboard
EOF
sa
$ cat << EOF | kubectl apply -f -
---
apiVersion: v1
kind: ServiceAccount
metadata:
  labels:
    k8s-app: grafana
  name: grafana-admin
  namespace: kubernetes-dashboard
---
apiVersion: rbac.authorization.k8s.io/v1beta1
kind: ClusterRoleBinding
metadata:
  name: grafana-admin
  labels:
    k8s-app: grafana
roleRef:
  apiGroup: rbac.authorization.k8s.io
  kind: ClusterRole
  name: cluster-admin
subjects:
- kind: ServiceAccount
  name: grafana
  namespace: kubernetes-dashboard
EOF
pv & pvc
$ cat << EOF | kubectl apply -f -
---
kind: PersistentVolume
apiVersion: v1
metadata:
  name: grafana
  labels:
    type: local
spec:
  storageClassName: manual
  capacity:
    storage: 2Gi
  accessModes:
    - ReadWriteMany
  hostPath:
    path: "/opt/grafana"
---
kind: PersistentVolumeClaim
apiVersion: v1
metadata:
  name: grafana
  namespace: kubernetes-dashboard
spec:
  accessModes:
  - ReadWriteMany
  resources:
    requests:
      storage: 2Gi
  storageClassName: "manual"
  volumeName: grafana
EOF
deploy
$ cat << EOF | kubectl apply -f -
---
apiVersion: extensions/v1beta1
kind: Deployment
metadata:
  name: grafana
  namespace: kubernetes-dashboard
  labels:
    app: grafana
    component: core
spec:
  replicas: 1
  strategy:
    rollingUpdate:
      maxSurge: 25%
      maxUnavailable: 25%
    type: RollingUpdate
  template:
    metadata:
      labels:
        app: grafana
        component: core
    spec:
      affinity:
        nodeAffinity:
          requiredDuringSchedulingIgnoredDuringExecution:
            nodeSelectorTerms:
            - matchExpressions:
              - key: kubernetes.io/hostname
                operator: In
                values:
                - kubems-01
      containers:
      - image: grafana/grafana
        name: grafana
        imagePullPolicy: IfNotPresent
        resources:
          # keep request = limit to keep this container in guaranteed class
          limits:
            cpu: 512m
            memory: 512Mi
          requests:
            cpu: 256m
            memory: 256Mi
        env:
          # The following env variables set up basic auth twith the default admin user and admin password.
          - name: GF_SERVER_DOMAIN
            value: "grafana.marslo.com"
          - name: GF_SECURITY_ADMIN_PASSWORD
            value: "mypasswd"
          - name: GF_INSTALL_PLUGINS
            value: "grafana-kubernetes-app"
          - name: GF_SERVER_ROOT_URL
            value: "/"
          - name: GF_AUTH_BASIC_ENABLED
            value: "true"
          - name: GF_AUTH_ANONYMOUS_ENABLED
            value: "false"
        readinessProbe:
          httpGet:
            path: /login
            port: 3000
        volumeMounts:
        - name: grafana-persistent-storage
          mountPath: /var/lib/grafana
      restartPolicy: Always
      terminationGracePeriodSeconds: 30
      serviceAccountName: grafana
      volumes:
      - name: grafana-persistent-storage
        persistentVolumeClaim:
          claimName: grafana
EOF
svc
$ cat << EOF | kubectl apply -f -
---
apiVersion: v1
kind: Service
metadata:
  name: grafana
  namespace: kubernetes-dashboard
  labels:
    app: grafana
    component: core
spec:
  type: CluslterIP
  ports:
    - name: http
      port: 3000
      protocol: TCP
  selector:
    app: grafana
    component: core
EOF
ingress
$ cat << EOF | kubectl apply -f -
apiVersion: extensions/v1beta1
kind: Ingress
metadata:
  name: grafana
  namespace: kubernetes-dashboard
spec:
  rules:
  - host: grafana.marslo.com
   http:
     paths:
     - path: /
       backend:
        serviceName: grafana
        servicePort: http
  tls:
  - hosts:
    - grafana.marslo.com
    secretName: marslo-cert
EOF
dashboard
[!NOTE|label:references:]
kubernetes cluster monitoring
-
install via
grafana-cli$ grafana-cli plugins install devopsprodigy-kubegraf-appsetup sa and cluster role
$ kubectl create ns kubegraf
$ kubectl apply -f https://raw.githubusercontent.com/devopsprodigy/kubegraf/master/kubernetes/serviceaccount.yaml
$ kubectl apply -f https://raw.githubusercontent.com/devopsprodigy/kubegraf/master/kubernetes/clusterrole.yaml
$ kubectl apply -f https://raw.githubusercontent.com/devopsprodigy/kubegraf/master/kubernetes/clusterrolebinding.yaml
$ kubectl apply -f https://raw.githubusercontent.com/devopsprodigy/kubegraf/master/kubernetes/secret.yaml
create private certificate
copy `/etc/kubernetes/pki/grafana-kubegraf.crt` to all masters$ openssl genrsa -out ~/grafana-kubegraf.key 2048 $ openssl req -new -key ~/grafana-kubegraf.key -out ~/grafana-kubegraf.csr -subj "/CN=grafana-kubegraf/O=monitoring" $ openssl x509 -req -in ~/grafana-kubegraf.csr -CA /etc/kubernetes/pki/ca.crt -CAkey /etc/kubernetes/pki/ca.key -out /etc/kubernetes/pki/grafana-kubegraf.crt -CAcreateserial- get token
$ kubectl get secret grafana-kubegraf-secret -o jsonpath={.data.token} -n kubegraf | base64 -d
- get token
-
@deprecated
- install via
grafana-cli$ grafana-cli plugins install kubernetes-app - setup
$ cat ~/.kube/config | grep certificate-authority-data | awk '{print $2}' | base64 -d
$ cat ~/.kube/config | grep client-certificate-data | awk '{print $2}' | base64 -d
$ cat ~/.kube/config | grep client-key-data | awk '{print $2}' | base64 -d
- install via
cluster
*
315- Kubernetes cluster monitoring (via Prometheus)
1.6.1.12.1.3 -- grafana-315.gif 6417- Kubernetes Cluster (Prometheus)3662- Prometheus 2.0 Overview
node
namespace
pod
jenkins
9524- a Jenkins performance and health overview for jenkinsci/prometheus-plugin9964- Jenkins: Performance and Health Overview
grafana settings
- cluster
label_values(kube_pod_info, cluster)- or
label_values(node_cpu_seconds_total, cluster)
- or
instance
label_values(apiserver_request_total{job="apiserver"}, instance)node
label_values(kube_node_info{cluster="$cluster"}, node)- or
label_values(kubernetes_io_hostname)
- or
namespace
label_values(kube_pod_info{cluster="$cluster"}, namespace)pod
label_values(kube_pod_info{cluster="$cluster", namespace="$namespace"}, pod)
api
references:
reset password
$ curl -X PUT -H "Content-Type: application/json" -d '{
  "oldPassword": "admin",
  "newPassword": "newpass",
  "confirmNew": "newpass"
}' http://admin:admin@<your_grafana_host>:3000/api/user/password
set grafana admin password
$ docker exec -t grafana \
              bash -c 'grafana-cli --homepath /usr/share/grafana admin reset-admin-password "{{ grafana_passwd }}"'
check if grafana can be accessed
$ curl -s http://localhost:3000/api/org \
       -u {{ grafana_user }}:{{ grafana_passwd }}
create datasoure in grafana
$ curl -L \
       --header 'Content-Type: application/json' \
       --header 'Accept: application/json' \
       -d@//docker_data/grafana_conf/grafanacfg.output http://localhost:3000/api/datasources \
       -u {{ grafana_user }}:{{ grafana_passwd }}
create TelegrafHost dashboard in grafana using jsonfile
$ curl -L \
       --header 'Content-Type: application/json' \
       --header 'Accept: application/json' \
       -d@/home/Configfiles/dashboards/TelegrafHostMetrics.json http://localhost:3000/api/dashboards/db \
       -u {{ grafana_user }}:{{ grafana_passwd }}
create DockerMetrics dashboard in grafana using jsonfile
$ curl --header 'Content-Type: application/json' \
       --header 'Accept: application/json' \
       -d@/home/Configfiles/dashboards/DockerMetricsperContainer.json http://localhost:3000/api/dashboards/db \
       -u {{ grafana_user }}:{{ grafana_passwd }}
create JVM dashboard in grafana using jsonfile
$ curl --header 'Content-Type: application/json' \
       --header 'Accept: application/json' \
       -d@/home/Configfiles/dashboards/jvm-metrics-jolokia-2_rev1.json http://localhost:3000/api/dashboards/db \
       -u {{ grafana_user }}:{{ grafana_passwd }}
add-ons
metric server
[!NOTE|label:references:]
sample yaml
apiVersion: v1
kind: ServiceAccount
metadata:
  labels:
    k8s-app: metrics-server
  name: metrics-server
  namespace: kube-system
---
apiVersion: rbac.authorization.k8s.io/v1
kind: ClusterRole
metadata:
  labels:
    k8s-app: metrics-server
    rbac.authorization.k8s.io/aggregate-to-admin: "true"
    rbac.authorization.k8s.io/aggregate-to-edit: "true"
    rbac.authorization.k8s.io/aggregate-to-view: "true"
  name: system:aggregated-metrics-reader
rules:
- apiGroups:
  - metrics.k8s.io
  resources:
  - pods
  - nodes
  verbs:
  - get
  - list
  - watch
---
apiVersion: rbac.authorization.k8s.io/v1
kind: ClusterRole
metadata:
  labels:
    k8s-app: metrics-server
  name: system:metrics-server
rules:
- apiGroups:
  - ""
  resources:
  - nodes/metrics
  verbs:
  - get
- apiGroups:
  - ""
  resources:
  - pods
  - nodes
  verbs:
  - get
  - list
  - watch
---
apiVersion: rbac.authorization.k8s.io/v1
kind: RoleBinding
metadata:
  labels:
    k8s-app: metrics-server
  name: metrics-server-auth-reader
  namespace: kube-system
roleRef:
  apiGroup: rbac.authorization.k8s.io
  kind: Role
  name: extension-apiserver-authentication-reader
subjects:
- kind: ServiceAccount
  name: metrics-server
  namespace: kube-system
---
apiVersion: rbac.authorization.k8s.io/v1
kind: ClusterRoleBinding
metadata:
  labels:
    k8s-app: metrics-server
  name: metrics-server:system:auth-delegator
roleRef:
  apiGroup: rbac.authorization.k8s.io
  kind: ClusterRole
  name: system:auth-delegator
subjects:
- kind: ServiceAccount
  name: metrics-server
  namespace: kube-system
---
apiVersion: rbac.authorization.k8s.io/v1
kind: ClusterRoleBinding
metadata:
  labels:
    k8s-app: metrics-server
  name: system:metrics-server
roleRef:
  apiGroup: rbac.authorization.k8s.io
  kind: ClusterRole
  name: system:metrics-server
subjects:
- kind: ServiceAccount
  name: metrics-server
  namespace: kube-system
---
apiVersion: v1
kind: Service
metadata:
  labels:
    k8s-app: metrics-server
  name: metrics-server
  namespace: kube-system
spec:
  ports:
  - name: https
    port: 443
    protocol: TCP
    targetPort: https
  selector:
    k8s-app: metrics-server
---
apiVersion: apps/v1
kind: Deployment
metadata:
  labels:
    k8s-app: metrics-server
  name: metrics-server
  namespace: kube-system
spec:
  selector:
    matchLabels:
      k8s-app: metrics-server
  strategy:
    rollingUpdate:
      maxUnavailable: 0
  template:
    metadata:
      labels:
        k8s-app: metrics-server
    spec:
      containers:
      - args:
        - --cert-dir=/tmp
        - --secure-port=4443
        - --kubelet-preferred-address-types=InternalIP,ExternalIP,Hostname
        - --kubelet-use-node-status-port
        - --kubelet-insecure-tls
        - --metric-resolution=15s
        image: registry.k8s.io/metrics-server/metrics-server:v0.6.3
        imagePullPolicy: IfNotPresent
        livenessProbe:
          failureThreshold: 3
          httpGet:
            path: /livez
            port: https
            scheme: HTTPS
          periodSeconds: 10
        name: metrics-server
        ports:
        - containerPort: 4443
          name: https
          protocol: TCP
        readinessProbe:
          failureThreshold: 3
          httpGet:
            path: /readyz
            port: https
            scheme: HTTPS
          initialDelaySeconds: 20
          periodSeconds: 10
        resources:
          requests:
            cpu: 100m
            memory: 200Mi
        securityContext:
          allowPrivilegeEscalation: false
          readOnlyRootFilesystem: true
          runAsNonRoot: true
          runAsUser: 1000
        volumeMounts:
        - mountPath: /tmp
          name: tmp-dir
      nodeSelector:
        kubernetes.io/os: linux
      priorityClassName: system-cluster-critical
      serviceAccountName: metrics-server
      volumes:
      - emptyDir: {}
        name: tmp-dir
---
apiVersion: apiregistration.k8s.io/v1
kind: APIService
metadata:
  labels:
    k8s-app: metrics-server
  name: v1beta1.metrics.k8s.io
spec:
  group: metrics.k8s.io
  groupPriorityMinimum: 100
  insecureSkipTLSVerify: true
  service:
    name: metrics-server
    namespace: kube-system
  version: v1beta1
  versionPriority: 100
q&a
$ curl -k https://api.server.com:6443/api/v1/model/metrics/
{
  "kind": "Status",
  "apiVersion": "v1",
  "metadata": {

  },
  "status": "Failure",
  "message": "model \"metrics\" is forbidden: User \"system:anonymous\" cannot get resource \"model\" in API group \"\" at the cluster scope",
  "reason": "Forbidden",
  "details": {
    "name": "metrics",
    "kind": "model"
  },
  "code": 403
}

$ kubectl get --raw "/apis/metrics.k8s.io/v1beta1/pods"
Error from server (ServiceUnavailable): the server is currently unable to handle the request

$ kubectl top node
Error from server (ServiceUnavailable): the server is currently unable to handle the request (get nodes.metrics.k8s.io)

$ kubectl describe apiservice v1beta1.metrics.k8s.io
Name:         v1beta1.metrics.k8s.io
Namespace:
Labels:       k8s-app=metrics-server
Annotations:  kubectl.kubernetes.io/last-applied-configuration:
                {"apiVersion":"apiregistration.k8s.io/v1","kind":"APIService","metadata":{"annotations":{},"labels":{"k8s-app":"metrics-server"},"name":"v...
API Version:  apiregistration.k8s.io/v1
Kind:         APIService
Metadata:
  Creation Timestamp:  2023-05-10T03:35:06Z
  Resource Version:    404029923
  Self Link:           /apis/apiregistration.k8s.io/v1/apiservices/v1beta1.metrics.k8s.io
  UID:                 a7f6a96d-eee3-11ed-9c0f-b883034b82d0
Spec:
  Group:                     metrics.k8s.io
  Group Priority Minimum:    100
  Insecure Skip TLS Verify:  true
  Service:
    Name:            metrics-server
    Namespace:       kube-system
  Version:           v1beta1
  Version Priority:  100
Status:
  Conditions:
    Last Transition Time:  2023-05-10T03:35:06Z
    Message:               endpoints for service/metrics-server in "kube-system" have no addresses
    Reason:                MissingEndpoints
    Status:                False
    Type:                  Available
Events:                    <none>
kube-state-metrics
[!INFO|label:references:]
installation
$ helm repo add prometheus-community https://prometheus-community.github.io/helm-charts
$ helm repo update
$ helm install kube-state-metrics prometheus-community/kube-state-metrics

# others
$ helm show values prometheus-community/kube-state-metrics
$ helm install -f config.yaml kube-state-metrics prometheus-community/kube-state-metrics

$ kubectl port-forward svc/kube-state-metrics 8080:8080
$ curl 127.0.0.1:8080/metrics | grep kube_node_status_capacity

# cost considerations
# values.yaml
metricAllowlist:
 - kube_node_info
 - kube_job_status_active
scripts
node resources
$ cat bin/node-resources.sh
#!/bin/bash
set -euo pipefail

echo -e "Iterating...\n"

nodes=$(kubectl get node --no-headers -o custom-columns=NAME:.metadata.name)

for node in $nodes; do
  echo "Node: $node"
  kubectl describe node "$node" | sed '1,/Non-terminated Pods/d'
  echo
done
one-line
$ kubectl get nodes |
          awk '{print $1}' |
          xargs -I {} sh -c 'echo  {} ; kubectl describe node {} | grep Allocated -A 5 | grep -ve Event -ve Allocated -ve percent -ve -- ; echo '

# alias
$ alias util='kubectl get nodes | awk '\''{print $1}'\'' | xargs -I {} sh -c '\''echo   {} ; kubectl describe node {} | grep Allocated -A 5 | grep -ve Event -ve Allocated -ve percent -ve -- ; echo '\'''
# or
$ alias util='kubectl get nodes -o 'jsonpath={.items[*].metadata.name} | fmt -1 | xargs -I {} sh -c '\''echo   {} ; kubectl describe node {} | grep Allocated -A 5 | grep -ve Event -ve Allocated -ve percent -ve -- ; echo '\'''
# or
$ alias util='kubectl get no --no-headers -o=custom-columns=NAME:.metadata.name | xargs -I {} sh -c '\''echo   {} ; kubectl describe node {} | grep Allocated -A 5 | grep -ve Event -ve Allocated -ve percent -ve -- ; echo '\'''